WTF is activation and why should engineers care?
Feb 06, 2025


On this page
- Why engineers should care about activation
- 1. It's upstream of other metrics
- 2. It's something engineers can directly influence
- 3. It’s useful across the organization
- How we find activation metrics at PostHog
- What to do after you’ve defined activation
- 1. Track it accurately
- 2. Review it
- 3. See how it correlates with other areas
- 4. Just improve it
Improving activation is one of the most impactful things a product engineer can do, but it’s also weirdly hard to define.
People often call it your product’s "aha" moment – i.e. when a user experiences your product's value for the first time – but this is vague and subjective.
So why isn't there a simple, universal definition? Because:
It’s unique to your product. No two products are exactly the same, so it’s impossible to generalize. This is also why activation benchmarks suck.1
It’s rarely a single event. You want users to do many actions in your product: complete onboarding, upload a file, share a link, watch a video. Activation could mean doing any of these, or a combination of them.
Activating may mean doing something multiple times. Someone might need to do the action multiple times in order to get it. For example, to activate into our session replay product means analyzing not one, but five replays.
One thing is certain, though. You can’t build a successful product without nailing it. Read on to understand why.
Why engineers should care about activation
1. It's upstream of other metrics
In a way, activation is the base rate of your product.
Want more revenue? Improve activation. Weak word-of-mouth growth getting you down? Improve activation. It compounds all the metrics downstream of it.
If being a product engineer means caring about the whole business (spoiler: it does), then you should be obsessed with your product’s activation metric.
A larger sample size (i.e. more activated users) also makes it easier to analyze and experiment on downstream metrics.
TL;DR: Everything is easier when activation is strong.
2. It's something engineers can directly influence
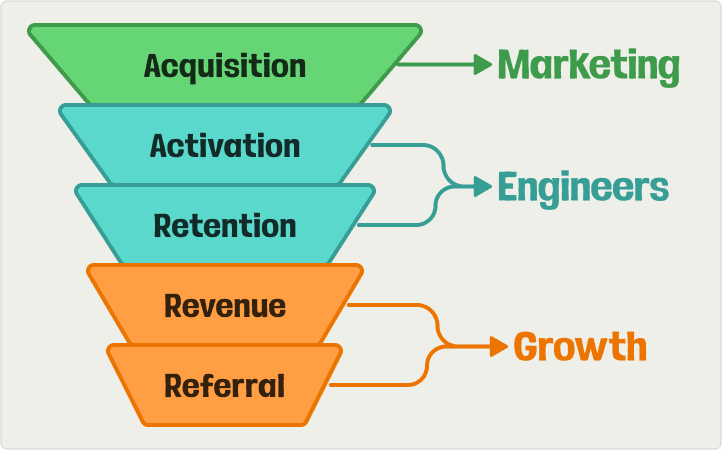
Activation is part of the AARRR funnel. Above it, at the top of the funnel, is acquisition which is mostly a responsibility of marketers.
Below it is retention, revenue, and referral. The last two are mostly platform-level metrics, and normally the responsibility of a smaller growth team.
That leaves activation and retention as the responsibilities of product engineers. Activation comes first and directly influences retention, so it’s a natural starting point.
3. It’s useful across the organization
For founders, it’s a signal of product market-fit and business health.
For marketers, it’s key for judging the success of their acquisition efforts.
For product teams, it shows the impact of product launches and changes.
For engineers, it clarifies what to work on better than “general usage.”
For customer-facing teams, it’s a warning that users aren’t succeeding.
As cringe as it is to say it, activation creates “ALIGNMENT” and figuring it out can create a lot of value for your organization as a whole.
How we find activation metrics at PostHog
We have 10+ products, each requiring their own activation metric, so we have a lot of experience finding activation metrics that work.
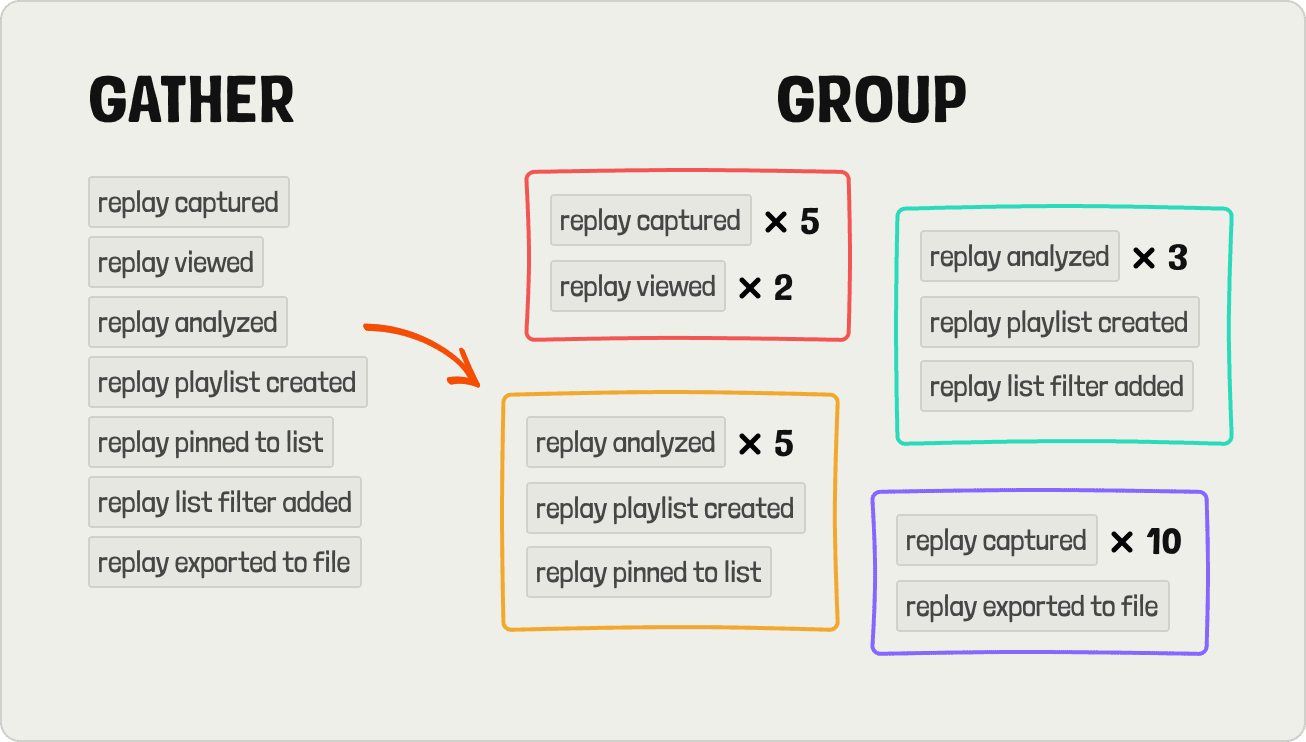
Our process starts by gathering a big list of events we think might "hook" users into our product. We get these by looking at usage of that specific product, and by asking customer-facing teams what they think.
Next, we create groups of 3-5 events to test together. Typically, we aim for 5-10 different groups, some of which compare how often an event is completed – e.g. watched five replays vs. watched one replay.
Once we have our potential activation metrics, we write an SQL query to test how they correlate with retention.
The query starts by getting the companies that signed up for PostHog, broken down by month. We use group analytics to find activated companies rather than individual users, but both work.
Next, we filter for companies who completed our collection of activation events in the required time. The time cutoff varies by the natural product lifecycle. It takes longer to collect enough data for product analysis than create an A/B test; therefore, product analytics has a 30-day activation window while experimentation only has 14 days.
After finding the companies who activated successfully, we calculate their retention by checking how many are still using the product three months after starting. We then compare the activated retention against our product's average retention rate.
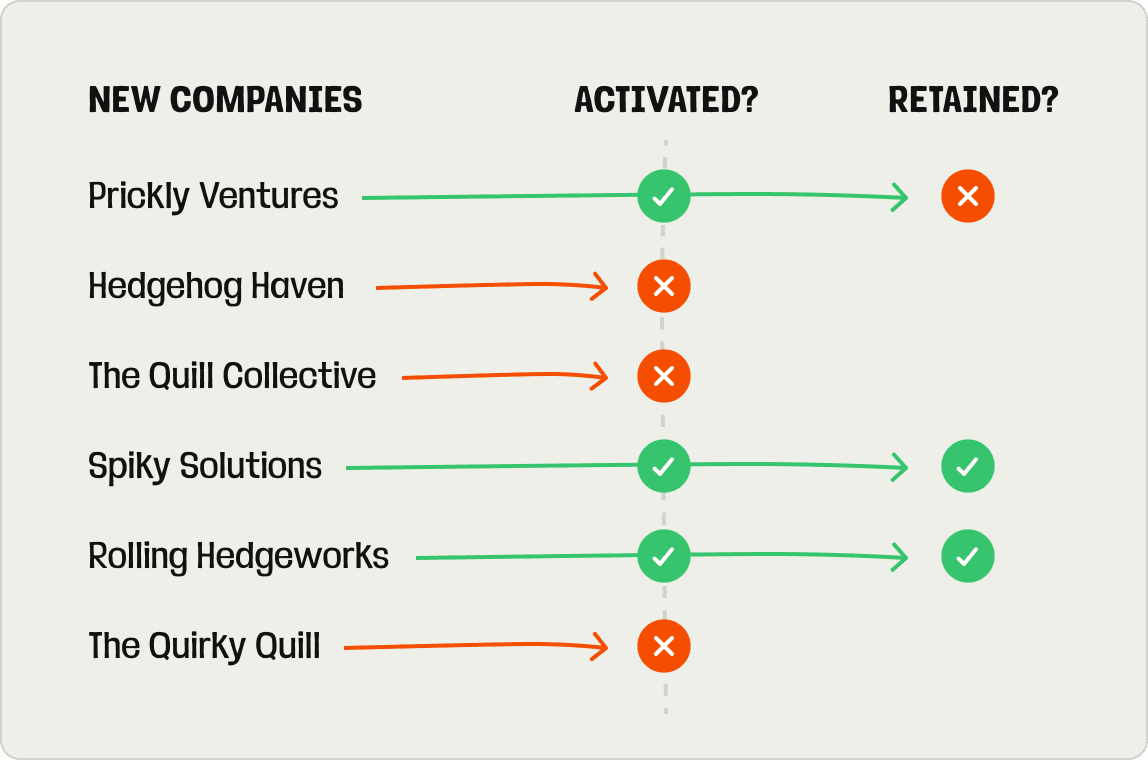
In the above hypothetical example, three companies activated but only two were still using the product after three months, and were therefore retained. This means we have a retention rate of 66% for activated companies:
If our average retention was lower than 66%, this would be a good activation metric. 🥳
If our average retention was higher than 66%, this would be a bad activation metric. 😭
We repeat this process for each potential activation metric. The one with the best retention rate (and a large enough sample size) wins.
Some activation metrics we found with this method:
- Experimentation: 1 experiment launched within 14 days.
- Feature flags: 2 feature flags created and 2 feature flags updated with property filters within 14 days.
- Product analytics: first team event ingested, 1 dashboard created, and 3 insights saved within 30 days.
- Surveys: 1 survey launched within 30 days.
- Session replay: 5 recordings analyzed and 1 recording list filters changed within 14 days.
Want to see the full real SQL query we used for these? Check out our post on How we found our activation metric (and how you can too).
What to do after you’ve defined activation

1. Track it accurately
Because your activation metric events now stand out, it's worth making sure they are tracked accurately. This means:
Refining when it’s captured. For example, is it better to capture an
uploaded fileevent when the upload starts or completes? Probably completes because it removes errored and retried uploads.Making sure it’s firing properly. We found that the recording analyzed event wasn't when we looked. This meant more teams were activating than we realized, and our metrics reliant on activation were inaccurate.
Capturing it on the server. Although setting up a reverse proxy is a good intermediate step, client-side events can still be ad blocked. Capturing your activation events on the server ensures you get them all.
2. Review it
Once we have an activation metric, it becomes part of our recurring growth reviews. For every product, every month, we check:
If it has dramatically changed and figure out the causes of that. Was it a change we made? Generally, we are happy when activation stays stable.
If we made changes aimed at improving activation, did they work? If not, why? If yes, is there more we can do?
The outcome of our growth reviews is a list of action items for the team to work on and then review in the next meeting.
3. See how it correlates with other areas
As activation is one part of the funnel, you can use it to evaluate and improve other parts of the funnel. For example, related to acquisition:
Explore what marketing activities have an impact on activation.2
Target marketing and onboarding work to improve activation rates.
Improve sales by using (lack of) activation as a sales lead health check.
And related to retention, revenue, and referral:
Look at activation's impact on retention beyond three months.
Using activation to look for opportunities to do sales-assist.
Finding ways to convert activated users into referrers.
A special, related one for us (and other multi-product companies) is cross-sell. Getting people to activate into multiple products (like product analytics + feature flags) is extremely valuable to us, because they are much more likely to pay, and pay more when they do.
Because of the importance of cross-sell, we look at how the activation of one product impacts another, figure out the "right" products to promote for a user's lifecycle, and look for opportunities to promote "cross-activation."
This is a big area of focus for our growth team.
4. Just improve it

Eventually, you need to actually build something to help activate users faster or provide them more motivation to activate. Some examples:
Creating email campaigns focused on your activation events
Tracking signup to activation conversion with funnels
Running experiments with your activation events as a goal metric
Launching surveys asking people why they don't activate
Connecting activation to sales or revenue data with our data warehouse
In one case for us, because the “replay list filter added” event is part of our activation metric, we focused on changes that encourage users to use playlists like our "What to watch" tab with playlist templates:

Paul Copplestone, CEO of Supabase, gave me a great answer when I asked how they tried to improve their activation metric of "weekly active databases":
Is it ever 1 thing? This metric has many drivers: increase new databases (by increasing new signups or make it compelling for existing signups to spin up many databases), reduce churn by ensuring no scalability issues, increase the growth of the database from "just trying it out" to "using in production" by reducing friction when building, etc.
Activation, for everyone, is a metric that is both business-critical and infinitely optimizable. For teams not sure how to use analytics to improve their product, this makes it an excellent place to start.

Subscribe to our newsletter
Product for Engineers
Read by 45,000+ founders and builders.
We'll share your email with Substack
- What about my benchmarks bro? Lenny's activation post also has some nice benchmarks for activation, but the ranges are extremely wide. Because the definition of "activation" varies between businesses, there's no real way to compare. When you are battling to increase your activation rates by single digit percentage points, having a range of 20%+ between "ok" and "good" isn't helpful.↩
- We found that viewing two web pages (e.g. our docs and product pages) before signing up led to a dramatically higher activation rate, compared to users who went straight from our homepage, or pricing page, to signing up.↩